My Amazon image A/B test: 26 vs 22, and what it shows
I rebuilt the image gallery of one of my own listings on amazon.com and let Amazon’s Manage Your Experiments run it against the old one for 8 weeks, on the same traffic, at the same time. Here is what I changed, Amazon’s numbers as reported, and what they can and can’t tell you.
I’ve sold my own private-label brand on Amazon since 2016. I test changes on my own listings before I advise on yours.
- 26 vs 22
- units sold, new gallery vs old (+18%)
- $2,126 vs $1,786
- sales, new vs old (+19%)
- 57%
- Amazon’s estimate that the new gallery is better: “weak evidence”
Amazon US, Seller Central → Manage Your Experiments, 10 Mar – 4 May 2026, 37,953 visitors in the test.
What Manage Your Experiments does
Manage Your Experiments is Amazon’s own A/B test for brand owners. It shows version A of your listing to one half of the visitors and version B to the other half, at the same time. Both halves see the same price, the same ads and the same season, so the content you changed is the only difference between them.
That is what makes it worth more than a before-and-after comparison. If you change your images in March and sales rise in April, the season, a coupon or a competitor running out of stock could explain it. In a split test, all of that hits both halves equally.
Amazon itself says experiments don’t affect your search ranking. You can test product images, the title, bullet points, the description, A+ Content and the Brand Story, or several of them in one experiment.
What I changed
One of my own products on Amazon US, an established listing with steady traffic. I changed the gallery, nothing else.
- The main image sells the product, not the room. Before, the product was a thin line at the edge of a busy scene. Now it fills the frame. The main image is the one shoppers see in search results, so it carries the most weight.
- No wasted slots. Two slots showed the same scene, and one was an EU energy label on a US listing. Both now answer a question a buyer actually asks.
- Specs a phone can read. One drawing carried ten measurements in small print. Now three big numbers carry the ones that matter.
Amazon’s numbers, as reported
Amazon US · 10 Mar – 4 May 2026 · my own listing
| Amazon’s metric | A: old gallery | B: new gallery | Difference |
|---|---|---|---|
| Sample size (visitors) | 18,948 | 19,005 | +57 |
| Units sold | 22 | 26 | +4 |
| Units sold from search | 5 | 7 | +2 |
| Sales | $1,786 | $2,126 | +$340 |
| Sales from search | $395 | $586 | +$191 |
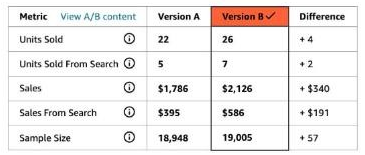
Amazon’s verdict: a 57% probability that version B is better, which it labels “weak evidence”. Its projection for keeping the new gallery a full year: most likely +$569 and +7 units, in a range from −$5,074 to +$6,212.
What it shows, and what it doesn’t
- It points one way. On the same traffic, the new gallery sold more units, made more sales and sold more from search. Nothing in the report points the other way.
- It is not proof. 48 units in total is a small sample. Amazon puts the chance that the new gallery is better at 57%, and its one-year range still includes a loss. I read it as a direction, not a promise, and I don’t promise you +18% either.
- It tested the gallery as a whole. It can’t say which of the changes did the work. After the test I kept improving the new version; those later changes weren’t tested separately.
How to run your own image test
- Check you can. Manage Your Experiments is open to brand owners enrolled in Amazon Brand Registry, on ASINs of their brand with enough traffic in recent weeks. Amazon only lists the ASINs that qualify; by Amazon’s description, high-traffic ASINs get several dozen orders a week or more, depending on the category. It runs on amazon.com and on the European marketplaces, amazon.de included.
- Pick one idea. One experiment per ASIN can run at a time. Test a whole new gallery, as I did, to see if the new direction sells; test single images later to learn which change works. Tests of the secondary images are only offered for ASINs with up to four child ASINs.
- Choose the duration. “To significance” ends when Amazon is confident, in as little as four weeks (offered for title, image and bullet point tests). Or set a duration: Amazon recommends 8 weeks, and experiments typically run 8 to 10.
- Leave everything else alone. The test splits the traffic, but a price change or a stock-out still makes the result harder to read.
- Read the probability, not only the units. Amazon reports units, sales, conversion rate, units per unique visitor and sample size per version, the probability that one version is better, and for finished tests a projected one-year impact with a best and worst case. It can publish the winner automatically only at a probability of at least 66%.
Not sure what to test first?
Send me an ASIN. Within 2 working days you get a free review of your gallery: the buyer’s question at every image, a verdict, 3 competitors and the 3 changes I’d make first. That’s a good list of what to test.